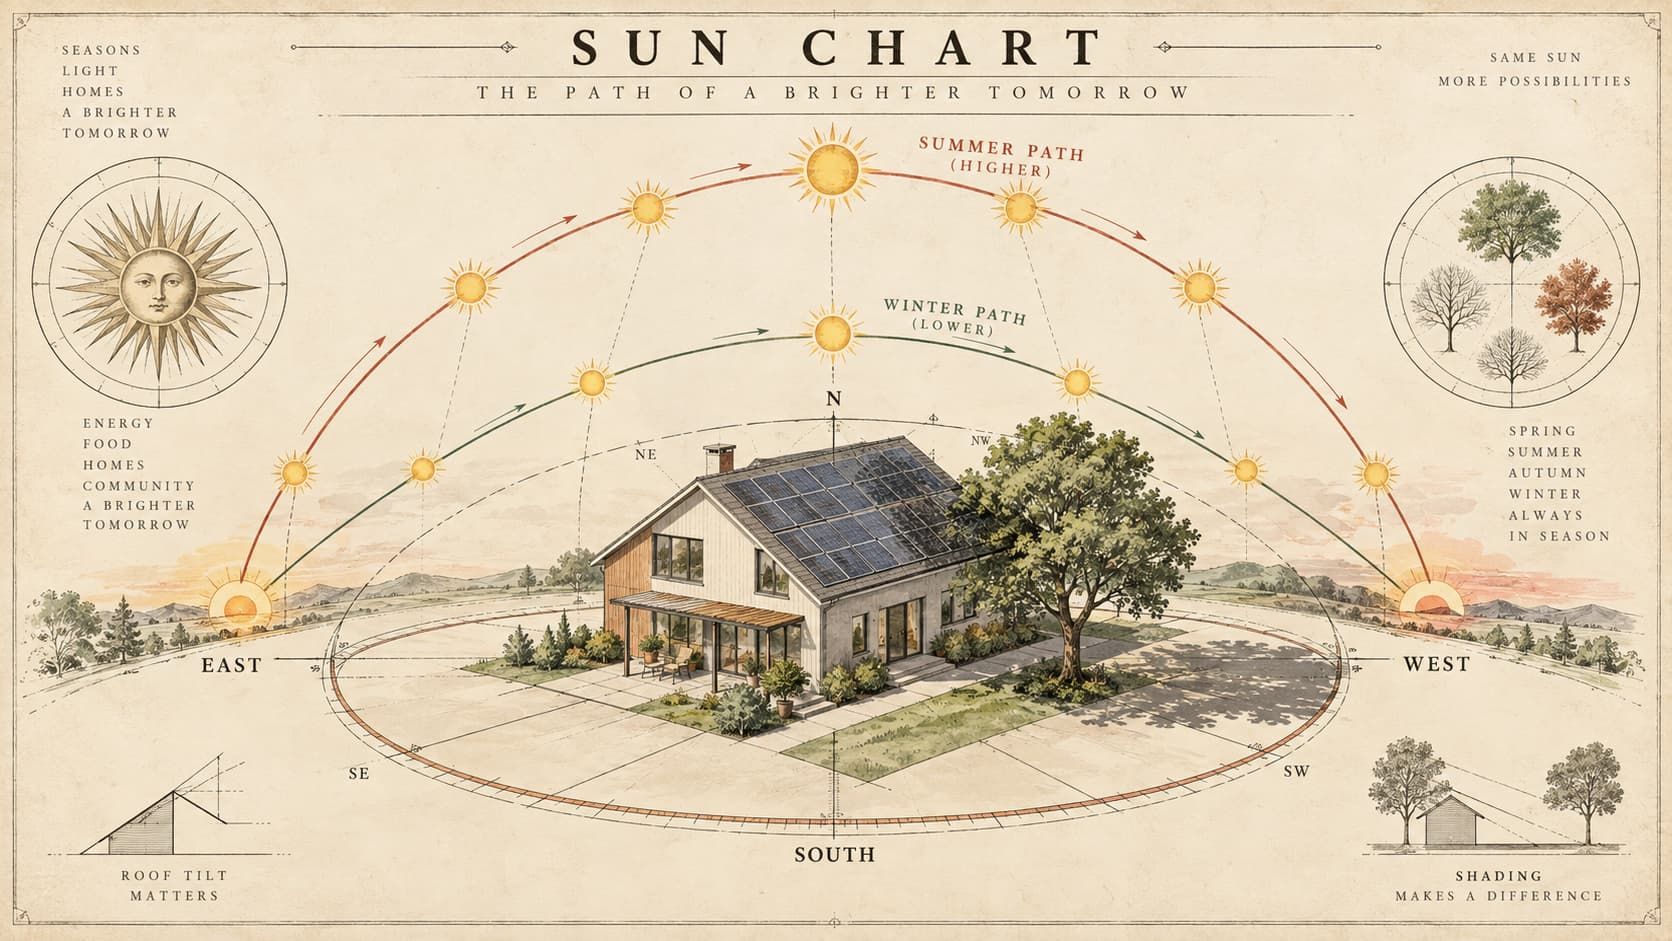
The sun is one of the important design tools that we have. Before solar panels were invented, architects, farmers, navigators and scientists watched how the sun moved across the sky to learn about seasons, daylight, heat and how the length of the day changes. Today that same knowledge can help us design homes that use sunlight wisely.
A sun chart is a picture that shows where the sun is in the sky during a day and over the year. It shows where the sun rises and sets at points on the horizon as seasons change and how high or low the sun looks. In summer the sun travels an longer route. In winter its route is lower and shorter. These changes directly affect how many rays of sunlight reach a roof, window, garden, greenhouse or solar panel.
For the Poquonnock Bridge Project understanding the sun is a part of understanding the house itself.
Seeing the Roof as an Energy Surface
A roof does more than keep rain and snow out of a building. When designed correctly a roof can also become a surface that produces energy.
Solar photovoltaic panels change sunlight into electricity. The amount of electricity a panel can produce depends on more than whether the sun is shining. Roof direction, roof slope trees around the roof nearby buildings, chimneys, dormers and other shades all influence how much useful sunlight reaches a panel.
The U.S. Department of Energy says that the solar potential of a roof depends on its size, shade, tilt, location and how it is built. In the Northern Hemisphere south-facing panels normally get yearly solar exposure though southeast- and southwest-facing roofs can also work well depending on the building and site.
That is why looking at the path of the sun is so useful before deciding where solar panels should be placed.
A Simple Way to Examine Your Roof
One of the tools we have found for taking an early look at rooftop solar potential is Google Project Sunroof.
Project Sunroof mixes pictures with computer modeling to estimate how sunlight reaches different parts of a roof. Google’s published method explains how roof shape, sunlight data and shadow calculations that consider trees, buildings and other obstacles are used. The system calculates direct and scattered sunlight over a year and uses that to model the solar energy reaching various roof surfaces.
That makes it useful as a step.
Of just looking at a satellite picture and guessing which part of the roof gets the most sun a homeowner can start with a visual estimate of where the strongest solar exposure might be.
You can explore it here: Project Sunroof. Sunroof.withgoogle.com.
Why the Sun’s Path Matters
The sun is always changing its position.
During one day the sun moves from east to west across the sky. Over the year its apparent path also moves north and south. Becomes higher or lower depending on the season.
That movement affects the design of a home.
A tree that gives shade at noon in June might cast a long shadow across a roof in a winter afternoon. A roof part that gets morning sunlight might lose direct exposure later in the day. A window that gives solar warmth in winter may need shade in summer.
Understanding these patterns lets us think about energy as part of the building design rather than as equipment added after the building is already made.
Solar Panels Are One Part of the Idea
For the Poquonnock Bridge Project following the sun is more than just producing electricity.
The same sunlight that powers photovoltaic panels can also affect heating, cooling, daylighting, greenhouse design and food production.
Windows can be placed to use daylight better. Roof overhangs can help control summer gain while letting lower winter sunlight enter. Greenhouses and vertical growing systems can be put where they get sunlight. Solar thermal systems can collect the sun’s heat for water or other building uses.
In words the sun can help decide where different systems should be placed.
This is one reason the orientation of a house matters a lot. If the structure, windows, roof parts, growing areas and energy systems are all designed separately chances can be lost. If they are designed around the movement of the sun, each part of the building can help the others.
From Historical Sun Charts, to Digital Modeling
The illustration shown in this article represents a way of visualizing the relationship between Earth and the sun. Before computers diagrams like these helped people understand movement, solar angles and the Earth’s yearly path.
The underlying idea has not changed.
What has changed are the tools.
Today, satellite images, digital terrain models, weather data and computer simulations can perform calculations that once required observation and hand‑drawn charts. Google’s Project Sunroof is one example of how these tools can make solar information easier for homeowners.
Digital tools should still be viewed as a starting point rather than a substitute for detailed design. The Department of Energy notes that online mapping tools give estimates using data while a solar installer can perform a more detailed evaluation of an individual property.
Following the Sun at Poquonnock Bridge
Our goal is not simply to place panels on a roof. The goal is to understand how sunlight moves across the property and then use that knowledge throughout the design of the home.
Where does the winter sun enter the building? Where does the summer sun create heat? Which roof surfaces receive the periods of useful sunlight? Where should solar panels be placed? Where should food‑growing areas be located? Where might trees provide summer shade without unnecessarily reducing solar production?
These questions turn the sun into part of the design process.
The Poquonnock Bridge Project is, about combining existing technologies in ways that make homes more efficient, productive, comfortable and less expensive to operate. Understanding the path of the sun is one of the places to begin.
Before we decide how to capture energy we first need to know where the sun will be.